Generation of the optic nerve head component response
This illustration details how the retinal component (RC) and optic nerve head component (ONHC) responses are generated within the retina and subsequently detected and characterized by multifocal electroretinographic (mfERG) techniques. The patient is exposed to stimuli consisting of 103 hexagons, the map of which we illustrate within the posterior part of the globe of the eye. Each stimulus consists of five frames – the first contains focal flashes (controlled by the VERIS pseudo-random m-sequence), the second and fourth contain global flashes, and the third and fifth frames are dark.
The photic stimulus generates response first in the photoreceptors and then in the retinal ganglion cells. In this illustration, the retinal patches of stimulation (orange hexagons) will yield electrical responses that are detected at the corneal surface with a Burian-Allen electrode. The large-amplitude RC (teal arrow) is directly derived from the stimulated retinal patch, representing the response of multiple cell types within the retina, with only a modest contribution made by the retinal ganglion cells. However, a smaller, later waveform following the RC is designated as the ONHC waveform. The action potential that is generated at the stimulated retinal patch is propagated (membrane conduction) via the retinal ganglion cell axons in the retinal nerve fiber layer to the optic nerve head.
The ONHC response (solid green arrow) is generated as this action potential traverses the lamina cribrosa and its conduction transforms from membrane to saltatory conduction (as the optic nerve axons obtain oligodendrocyte myelination). As the ONHC is generated at the optic nerve head region, its latency is contingent upon the distance of the stimulated retinal patch from this region (i.e., the farther the patch, the longer the latency) and the thickness of the axons transmitting the action potential (i.e., the thicker the axons, the shorter the latency). In the context of ocular or neurologic disease that affects the RGC, RGC axons, or optic nerve myelin, the ONHC would appear abnormal or be completely lost (broken green arrow).
Subsequent modifications in the mfERG stimulus paradigm (specifically, by appending one or more global flashes after the m-frame to emphasize the fast adaptive mechanisms that give rise to the induced components) have improved the ability to elucidate RGC activity in the first-order kernel mfERG responses [57]. As stated previously, it was with the second-order first slice K2.1 that enabled us to elucidate the ONHC. Response waveforms obtained by these global flash paradigms consist of a direct component and several induced components (which are dominated by the RC and ONHC) [57–58]. The RC represents the contributions of diversified elements across different layers of the retina. Alternately, the normal ONHC response is derived from the inner retinal, with an onset latency that is related to the distance from the retinal patch of stimulation to the optic nerve head.
While the RC response is directly derived from the patch of retinal stimulation and recorded by the corneal electrode, the ONHC response is contingent on the integrity of the RGC, its axon, and the associated propagation of the action potential from the patch of retinal stimulation, beyond which it travels to the optic nerve head, and subsequently across the lamina cribrosa. With these principles in mind, we can understand how those patches of retinal stimulation that are closest to the optic nerve head will reveal ONHC responses of shortest latency, while those patches stimulated furthest away will generate the longest latency responses (resembling a chevron-like pattern; Figure 8.2).
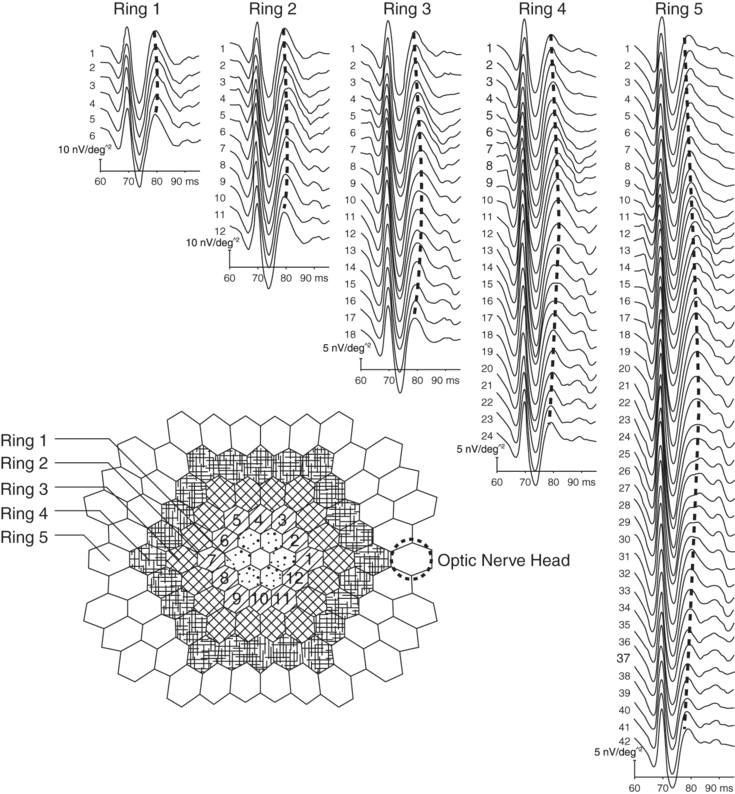
The appearance of the normal optic nerve head component response.
The stimulus array consists of hexagonal patches arranged in a series of concentric rings, each progressively more eccentric from the fovea centralis. Ring 1 is the closest to the fovea, and Ring 4 the farthest away. By convention, the stimulation pattern begins at the peripapillary zone, then proceeds superiorly, temporally, and inferiorly, and ultimately returns to the peripapillary zone. This results in the progressive increase and subsequent decrease in the ONHC latency (for patches of equal eccentricity from the fovea centralis) and gives rise to the chevron-like pattern (marked by the dashed lines) of the ONHC response when displayed in the trace array. This chevron-like pattern is an important feature seen in normal ONHC responses.
The ONHC in animal studies
Pig eyes are morphometrically quite similar to human eyes, and also demonstrate a late positive mfERG waveform (referred to as the P3 peak) [59] that bears a striking resemblance to the ONHC response in human beings. As in the human ONHC response, the P3 peak is predominantly related to RGC activity, a hypothesis that has been corroborated by studies that demonstrated abolishment of these late responses following the administration of tetrodotoxin, isoflurane, and NMDA, and by its time-related deterioration following optic nerve section [59–60]. While the P3 did not demonstrate the expected changes in latency with distance from the optic nerve head (as in human beings and primates), this may be due to interspecies morphometric differences [59].
Macaques also demonstrate a very prominent ONHC (due to the high number of RGCs) [61]. Its elimination by intravitreal TTX [62–64] and disruption in advanced glaucoma [33] indicates the prominent contribution of RGC activity to this waveform.
The normal human ONHC
Our group sought to study the characteristics of the optic nerve head component response (ONHC) responses in a cohort of normal human subjects. We demonstrated two principal response waveforms: the retinal component (RC) and ONHC (Figure 8.2). The RC is a conspicuous, large-amplitude waveform consisting of an initial negative trough, a positive deflection, followed by a second negative trough. The RC response demonstrated constant peak latency, irrespective of distance or eccentricity from the optic nerve head. This finding supports the hypothesis that the RC is composed of various cellular responses (and not purely RGC activity) and is directly derived from each stimulated retinal patch [56, 65].
The ONHC is the positive waveform occurring immediately following the second negative trough of the RC. Its peak latency varied with distance and eccentricity from the ONH. Within rings of equal eccentricity, the ONHC peak latency was directly proportional to the distance of the stimulated retinal patch from the optic nerve head. This observation supports the hypothesis that the ONHC is ultimately generated in the region of the optic nerve head and is, therefore, dependent on the time needed for an action potential to travel via membrane conduction from the RGC to the optic nerve head, at which point the axons bend into the optic cup, penetrate the lamina cribrosa, and become myelinated.
Within rings of equal eccentricity (meaning a circular pattern of retinal patch stimulation, with each patch equidistant to the center point of the ring), the ONHC latency is contingent upon the length of the axons transmitting the stimulus to the optic nerve head. The shortest latency responses were those closest to the ONH, while those further away were delayed commensurate with their distance from the optic nerve head.
Of interest, we also found that ONHC peak latency was inversely related to eccentricity away from the central macula across successive rings (i.e., the ONHC peak latency decreased with increasing eccentricity from the central macula, in the vertical meridian). While this may seem counterintuitive (since the distance of the stimulation patch is farther away from the ONH), this finding is corroborated by changes that occur in retinal anatomy and physiology with eccentricity, and it is in keeping with principles of cable theory.
Sutter et al. showed that the calculated propagation velocities derived from concentric rings, characterized by increasing eccentricity from about 40 cm/s in Ring 1 (smallest diameter ring of retinal patch stimulation) to 120 cm/s in Ring 4 [56]; these propagation velocities are comparable to those found by means of antidromic stimulation in feline [66] and primate [67–68] optic nerves. Axonal propagation velocities in unmyelinated fibers are linearly correlated to the square root of their axon diameters (v = k √D; where 1.4 < k < 1.8) [56, 67]; the faster conduction speed in the outer rings would imply that the axonal fibers of these rings have a greater diameter than those situated within the inner rings (consistent with axonal cable theory). Primate and human studies have shown that the mean RGC axon diameter is smallest in the immediate vicinity of the central fovea (in particular, within the papillomacular bundle; PMB) and increases as one travels eccentrically towards the superior and inferior arcuate bundles [67–72]. Even within the proximal 20° of angular distance from the fovea (i.e., the area of the retina stimulated by the hexagonal array), there is a gradual increase in axonal diameter with growing eccentricity [70]. Notably, the mean axon diameter of the inferior arcuate bundle is larger than the superior bundle [67–72], in keeping with our ONHC latency profiles, with a significantly lower latency associated with the inferior outer ring responses when compared with positionally analogous (along the vertical extent of the concentric rings) patches in the superior retinal field (data in preparation).
While the peak latencies of both the RC and ONHC demonstrated consistent characteristics between subjects, the amplitude of both waveforms were more variable, leading us to instead analyze the ONHC:RC peak amplitude ratio. The wide variation we found in the absolute values of the RC and ONHC peak amplitudes is not surprising since there is a twofold range in total RGC number in normal eyes, reflected by the number of axons in the optic nerve (between 846,000 and 1.7 million) [73]. Further, ERG amplitudes vary between healthy subjects and are influenced by factors such as fundus pigmentation [74] and globe axial length, as in high myopes [75]. This broad range makes it more difficult to establish normal parameters for both the RC and ONHC peak amplitudes, which is reflected by the wide amplitude variability.
That variability was reduced when we examined the ONHC:RC peak amplitude ratio, given that both components are affected similarly by a number of confounding factors. Pathological processes extending beyond the inner retina would be expected to affect both the RC and ONHC (while minimally impacting the ONHC:RC ratio), while a purely inner retinal disorder would predominantly affect the ONHC (decreasing the ONHC:RC ratio). In this circumstance, the ONHC:RC ratio may have utility for the identification of patients with dysfunction restricted to the inner retina.
Another characteristic we observed was that both the RC and ONHC peak amplitudes decreased with growing eccentricity from the optic nerve head, as a result of a decrease in retinal cell densities (both RGC and cones) with increasing eccentricity [56, 65, 73]. The ONHC:RC peak amplitude ratio diminished with eccentricity as a consequence of greater ONHC peak amplitude diminution [65]; this is corroborated by the declining RGC:cone density ratio with eccentricity [73].
The ONHC in neurologic and ophthalmic disease
Our investigative team has proceeded to evaluate ONHC abnormalities in a small group (n = 7) of MS patients with and without prior ON, and to compare the ONHC changes with those of structural (OCT, fundus photography) and functional (visual perimetry, infrared pupillometry, contrast acuity, mfVEP, and mfERG) metrics [65]. We demonstrated correspondence between abnormal visual field loss, reduced contrast acuity, reduced RNFL thickness, mfVEP cortical response asymmetry, the presence of an objective RAPD, and abnormalities of the ONHC [65]. Using a larger cohort of MS patients with prior unilateral ON (n=18), we demonstrated a robust relationship between ONHC abnormalities and low contrast visual acuity and RNFL thinning as measured by spectral-domain OCT. An example of abnormal ONHC responses in an MS patient with prior optic neuritis is provided in Figures 8.3 and 8.4.
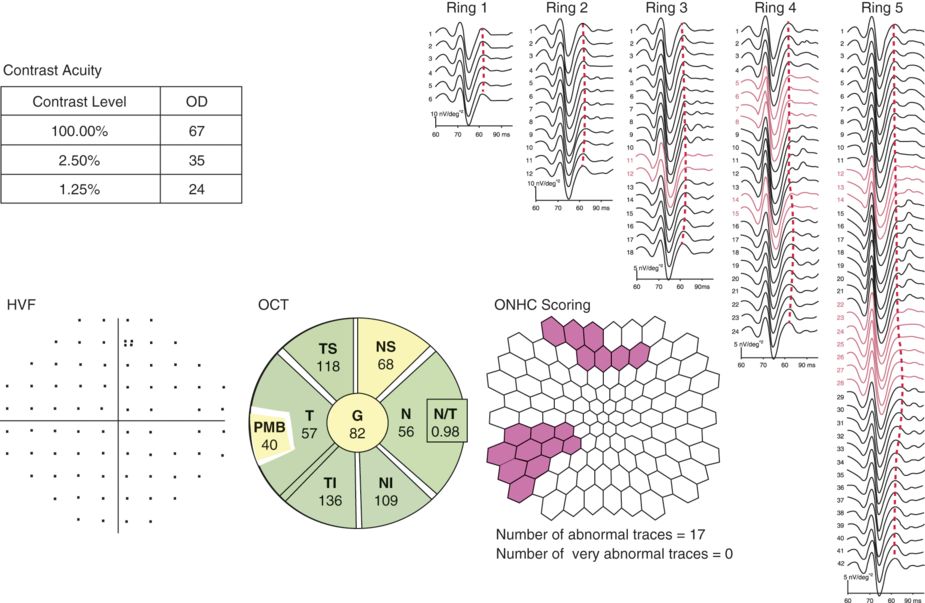
The optic nerve head component response in the eye of an MS patient without a history of optic neuritis.
Here we present data from the unaffected (historically) right eye from a patient with multiple sclerosis who had prior left acute optic neuritis. The upper-left text box indicates the number of correct letters identified on contrast acuity charts (at 100%, 2.5%, and 1.25% levels). Below, we show the normal pattern-deviation plot from Humphrey automated perimetry, using the 30–2 test. In the lower-left aspect of the figure, we present the retinal nerve fiber layer (RNFL) thickness analysis by spectral-domain optical coherence tomography (OCT; Spectralis, Heidelberg, Germany). The average RNFL thickness is mildly reduced (at 82 microns for the “unaffected” right eye), suggesting the presence of occult disease activity. On the right aspect of the figure, we present the concentric rings of retinal patch stimulation, with the ONHC responses aligned vertically. The waveforms traced in red are those where the ONHC is either abnormal or absent. The retinal patch topography map (bottom middle part of the figure) indicates the location of the abnormal or absent responses.
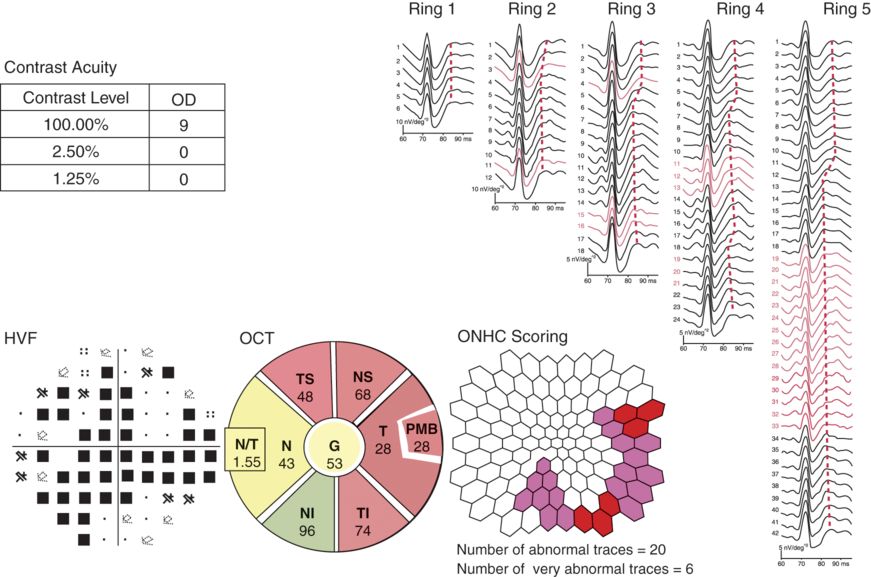
The optic nerve head component response in the eye of an MS patient previously affected by optic neuritis.
Here we present data from the same patient in Figure 8.3, but derived from the left eye that was previously affected by optic neuritis. Bedside examination revealed a severe left relative afferent pupillary defect. On ophthalmoscopic examination, there was diffuse optic disc pallor (signifying chronic changes, compositionally most consistent with astrogliosis, a cardinal histopathologic feature of chronic MS-related optic neuropathies). Note the severe loss of acuity (in both high- and low-contrast acuity levels), the broad suppression of the corresponding Humphrey visual field, and the optical coherence tomography (OCT) retinal nerve fiber layer (RNFL) topography map demonstrating diffuse thinning of the RNFL (both average and several sectors; red indicates RNFL thickness levels below 1% of predicted for a matched population). On the right aspect of the figure, note the more diffuse nature of the abnormal or absent optic nerve head component (ONHC) responses. Compared to the right eye, the waveforms are more poorly defined or absent.
There is evidence that abnormalities of the ONHC are present in early glaucoma in human beings [76] and in nonhuman primates (as discussed earlier). Additionally, there is anecdotal evidence that ONHC perturbation occurs in Leber’s hereditary optic neuropathy (LHON) [77].
Limitations
A major drawback to the application of ONHC responses is the lack of an objective method for accurately quantifying abnormalities of this RGC-specific response. With existing technology, we are already able to quantify the amplitude and peak latency of the waveform. However, in disease states, the magnitude of response disorganization may preclude the accurate identification of latency or amplitude measures. Given this, there is a need to develop techniques that permit accurate quantitative methods for the assessment of the ONHC response.
Given the constellation of complex and time-intensive investigations, we cannot underscore enough the importance of working with highly trained and experienced neuro-ophthalmic technicians. The technician is responsible for ensuring proper scientific protocol is observed to ensure data integrity as well as safeguarding patient safety and dignity.
Finally, since the subject is required to fixate on a target during recording, uncooperative patients and those with pendular nystagmus or severely impaired visual acuity are typically excluded from participating in studies examining the ONHC.
Future directions
Any objective assessment strategy to characterize the ONHC response is likely to be contingent upon the high precision, valid, and reproducible methods for dissecting the mechanisms that impact the RGC from the cell body, the anatomic course of the RGC axons as they “sweep” through the RNFL and into the optic nerve head (at the neural retinal rim), and ultimately exit the eye through the lamina cribrosa en route via the retino-geniculo-calcarine pathways for vision to the rostral midbrain for eliciting the pupillary light reflexes, with the smallest number of projections navigating their way from the eye to the hypothalamus, and thereby contributing to a number of important bodily processes including mood regulation, cognitive vigilance, hunger, thirst, and satiety, thermoregulation, the neuroendocrine reflex arcs, sleep–wake cycle transitions. In this analysis scheme, we will need to precisely identify the response latency (and timing responses) in conjunction with the magnitude of ONHC responses.
The ultimate goal is to explore the relationship between structural architecture and corresponding measures of neurophysiology in the visual system, with an eye toward elucidating a surrogate biomarker(s) for the CNS in degenerative disorders in general, and for MS in particular. We propose that the ONHC response is a viable, sensitive, and objective method for assessing and monitoring RGC structure and function, as well as anterior optic nerve myelin integrity. Diseases that may be expected to result in ONHC response abnormalities include glaucoma, ischemic optic neuropathies, hereditary optic neuropathies (e.g., LHON), and demyelinating disorders (in particular, MS and neuromyelitis optica, NMO).
Early detection and treatment of glaucoma, one of the leading causes of blindness in the world, helps arrest subsequent progression to irreversible visual loss [76]. The ONHC response may, therefore, help provide localized and early evidence of RGC dysfunction in glaucoma (particularly low-tension glaucoma) and hence permit early intervention and prevention of visual loss.
| CVEP | MfVEP | ERG | PERG | MfERG | ONHC | |
|---|---|---|---|---|---|---|
| Outer Retina (widespread defect) | Abnormal | Abnormal | Abnormal | Normal | Abnormal | Normal |
| Outer Retina (focal defect) | Likely normal | Abnormal | Possibly normal | Normal | Abnormal | Normal |
| Inner Retina (widespread defect) | Abnormal | Abnormal | Likely normal | Abnormal | Abnormal | Abnormal |
| Inner Retina (focal defect) | Likely normal | Abnormal | Normal | Possibly normal | Possibly normal | Abnormal |
| Macula | Abnormal | Abnormal | Likely normal | Likely normal | Abnormal | Abnormal |
| Optic Nerve | Abnormal | Abnormal | Normal | Normal | Normal | Abnormal |
| Chiasm | Abnormal | Abnormal | Normal | Normal | Normal | Normal |
| Retrochiasmatic | Abnormal | Abnormal | Normal | Normal | Normal | Normal |
This table provides some general guidelines about how various lesions along the afferent visual pathway may affect electrophysiologic tests. CVEP: conventional pattern reversal visual evoked potential; MfVEP: multifocal visual evoked potential; ERG: electroretinography; PERG: pattern electroretinography; MfERG: multifocal electroretinography; ONHC: optic nerve head component response.
| Retinal Component Characteristics | Directly generated at the stimulated retinal patch from the responses of various cell types. RC peak latency remains constant regardless of distance from the optic nerve head (ONH) and eccentricity. |
| ONHC Characteristcs | Generated in the vicinity of the ONH from inner retinal activity from the transformation of membrane to saltatory conduction (as unmyelinated RGC axons acquire oligodendrocyte myelin at the level of the lamina cribrosa). Within rings of equal eccentricity (and across the horizontal meridian), ONHC peak latency is contingent upon the distance of the stimulation patch from the ONH; this is responsible for the “chevron-like” pattern on the trace analysis. Across rings of increasing eccentricity in the vertical meridian, the ONHC peak latency diminishes; this is a result of increasing RGC axonal diameter as one moves from the papillomacular bundle to the superior and inferior arcuate fibers. Of note, ONHC peak latencies for retinal areas corresponding with the inferior arcuate are lower than those of the superior arcuate since axonal caliber is greater in the inferior fibers. ONHC peak amplitude diminishes to a greater degree than the RC with growing eccentricity since RGC density decreases more steeply than those of other retinal cell types. |
| Potential applications of the ONHC | Any disorder that perturbs inner retinal, RGC axons, or anterior optic nerve myelin/axonal integrity may disrupt the ONHC. Therefore, it may be useful in monitoring disease activity and treatment responses in the following disorders: multiple sclerosis, neuromyelitis optica, Leber’s hereditary optic neuropathy, glaucoma, ischemic optic neuropathies, and toxic-metabolic optic neuropathies. |
| ONHC compared to other electrophysiologic tests | Compared to conventional and multifocal ERG, the ONHC assesses inner retinal and anterior optic nerve integrity. ONHC abnormalities indicate more localized damage (inner retinal, RGC axon, or anterior optic nerve) compared to visual evoked potentials (VEP), which assess the entire retino-geniculo-calcarine pathway. Unlike multifocal VEP studies, ONHC responses do not require interocular comparison. ONHC responses provide superior spatial resolution compared to conventional and pattern ERG as well as conventional VEP. |
| Limitations of the ONHC | The ONHC is a novel electrophysiologic metric and as such, inter-rater, intra-rater, and test–retest variability studies, as well as reliable quantification methods, are needed. Related posts: Optical coherence tomography in neurologic clinical trials Optical coherence tomography in neurologic clinical trials
 Optical coherence tomography and optic nerve magnetic resonance imaging in demyelinating diseases Optical coherence tomography and optic nerve magnetic resonance imaging in demyelinating diseases
 Optical coherence tomography and brain magnetic resonance imaging in multiple sclerosis Optical coherence tomography and brain magnetic resonance imaging in multiple sclerosis
 Optical coherence tomography in neurodegenerative and other neurologic diseases Optical coherence tomography in neurodegenerative and other neurologic diseases
 Optical coherence tomography and visual outcomes in acute optic neuritis Optical coherence tomography and visual outcomes in acute optic neuritis
 Optical coherence tomography in a multi-center setting: quality control issues Optical coherence tomography in a multi-center setting: quality control issues
Stay updated, free articles. Join our Telegram channel
Full access? Get Clinical Tree


|