Eye of a healthy control subject.
(A) Fundus photograph from a healthy control subject. (B) A three-dimensional macular volume cube generated by spectral-domain OCT (Cirrus HD-OCT) from the macular region denoted by the red box in panel A from the same healthy control subject. Note the individual layers of the retina are readily discernible, except for the ganglion cell layer (GCL) and inner plexiform layer (IPL), which are difficult to distinguish. During the segmentation process (performed in 3-dimension), the segmentation software identifies the outer boundaries of the macular retinal nerve fiber layer (RNFL), IPL, and outer plexiform layer (OPL), as well as the inner boundary of the retinal pigment epithelium (RPE), which is identified by the conventional Cirrus HD-OCT algorithm. The identification of these boundaries facilitates OCT segmentation, enabling determination of the thicknesses of the macular RNFL, GCL+IPL, the inner nuclear layer (INL) + OPL, and the outer nuclear layer (ONL), including the inner and outer photoreceptor segments. (C) Illustration of the cellular composition of the retinal layers depicted in panel B. ELM indicates the external limiting membrane; ILM, the inner limiting membrane; IS, the inner photoreceptor segments; and OS, the outer photoreceptor segments.
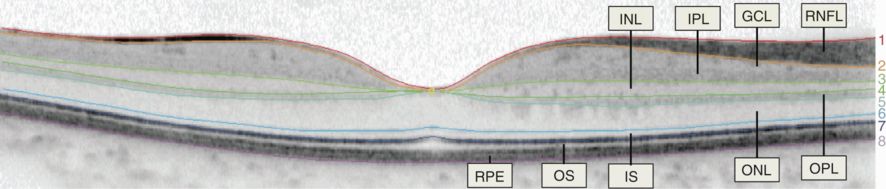
Example of a manually segmented spectral-domain OCT (Spectralis) macular B-scan traversing the fovea.
(1) inner limiting membrane, (2) outer boundary of retinal nerve fiber layer, (3) outer boundary of inner plexiform layer, (4) outer boundary of inner nuclear layer, (5) outer boundary of outer plexiform layer, (6) external limiting membrane, (7) inner/outer photoreceptor segment junction, (8) Bruch’s membrane. Layers: (1–2) = RNFL; (2–3) = GCL+IPL (note the minimal difference in contrast between the two layers, the border has not been segmented); (3–4) = INL; (4–5) = OPL; (5–6) = ONL; (6–7) = IS; and (7–8) = OS + RPE (OS/RPE border has not been segmented)
Functionally, the retina may be considered as being composed of three nuclear layers (where the cell bodies of the retinal neurons are located) that are separated by the two plexiform layers, where the synaptic connections between the retinal neurons are located. The flow of information occurs in the following direction: Photoreceptors –> Bipolar Cells –> Ganglion Cells. Furthermore, retinal interneurons include the horizontal and amacrine cells, which modify the signals between the photoreceptors and bipolar cells, and bipolar and ganglion cells, respectively.
Retinal segmentation
The discussion of the technical details of segmentation is beyond the scope of this chapter, but in general this process may be performed either manually by an individual visually identifying the boundaries between retinal layers and using specialized software in order to trace them, or by applying computerized algorithms that automatically detect retinal boundaries. Manual techniques have been employed in small-scale studies and for the validation of automated segmentation algorithms, and have provided important information in studies of retinal involvement in neurological disease. As can be expected, however, manual segmentation is an extremely tedious and time-consuming process and, thus, cannot be used for large-scale clinical studies or in everyday clinical practice. Automated segmentation algorithms have been commercially available for many years and have primarily focused on the segmentation of the RNFL in a ring scan around the optic disc; thus, the peripapillary RNFL thickness has been the most extensively utilized OCT measure in both research studies and clinical practice. Other measures that may be quantified with commercially available software include the average macular thickness and total macular volume. These measures have been shown to demonstrate excellent reproducibility, especially with modern spectral-domain OCT, and their reliability can be maximized by ensuring optimal scan acquisition.[3, 4].
All quantitative OCT measures are obviously derived from segmentation of OCT images; however, we make the distinction between “conventional” OCT measures, which include the peripapillary RNFL thickness, the average macular thickness and the total macular volume, and “intra-retinal segmentation derived” measures, which include the thicknesses of individual or composite layers in the macular area. Intra-retinal segmentation has been made possible by advances in scan acquisition with the advent of high-resolution spectral-domain OCT and also by the development of sophisticated automated algorithms. As previously mentioned, contrast is generated between retinal layers on OCT by differences in their optical properties, which result from their varying histological composition, and high reflectivity layers correspond to areas where retinal elements are arranged horizontally, such as the RNFL and plexiform layers, whereas the nuclear layers exhibit relatively lower reflectivity. Of note, however, is the fact that the contrast difference between the GCL and IPL is small, and consequently the boundary between these layers is difficult to assess (Figure 13.2) [5, 6]. The same, but to a lesser extent, is also true of the INL and OPL. Thus, distinguishing these layers has been challenging and the vast majority of studies utilizing intra-retinal segmentation in the study of neurological disease have utilized composite measures, including the combined GCL and IPL (GCL+IPL) and combined INL and OPL (INL+OPL). In addition to these composite measures, the macular RNFL and the ONL, including the photoreceptor segments, have also been utilized, and all these layers may now be isolated with great accuracy and reliability with fully automated segmentation algorithms.
Retinal segmentation in demyelinating diseases of the central nervous system
Multiple sclerosis
Multiple sclerosis (MS) is an inflammatory disorder of the central nervous system that has a predilection to affect the optic nerves clinically and subclinically. Acute optic neuritis (ON) is the initial demyelinating event in 15–20% of patients with MS and occurs at some time during the course of the disease in 50% of patients [7]. Moreover, postmortem studies have revealed that 94–99% of MS patients have demyelinating plaques in their optic nerves, irrespective of ON history [8, 9]. Retinal pathology is thought to occur primarily secondary to optic nerve involvement in MS; optic nerve inflammation and demyelination results in axonal transection and retrograde degeneration of its constituent fibers, leading to atrophy of the RNFL, the innermost retinal layer, where these axons originate. Degeneration of the retinal nerve fibers in turn leads to death of retinal ganglion cells (the neurons from which these axons are derived) via apoptotic mechanisms [10]. Pathologic studies examining the retinas of patients with MS have demonstrated atrophy of the inner retinal layers (RNFL and GCL) in 71–79% of eyes of patients with MS [11, 12].
In addition to the inner retinal layer pathology observed in MS, evidence exists that deeper retinal layers may also be affected in MS, with extensive qualitative atrophy of the INL identified in over 40% of MS eyes [12]. Also, studies employing electroretinography have identified abnormalities suggestive of INL and ONL dysfunction in MS [13–15]. Furthermore, retinal perivascular inflammation (periphlebitis), suggesting disruption of the blood–retina barrier, occurs in up to 20% of patients with MS. Active retinal periphlebitis tends to occur simultaneously with disruption of the blood–brain barrier in these patients, and may be a risk factor for relapses and gadolinium-enhancing lesions [16, 17]. Intermediate uveitis, especially pars planitis, also occurs in up to 15% of patients with MS [12]. Consistent with these clinical observations, postmortem analyses show retinal inflammation with activated microglia in the eyes of people with MS [12].
Collectively, these findings show that the retina is a common site of inflammation, disruption of the blood-retina barrier, and neuronal-axonal loss in MS. Thus, in the study of MS the retina represents a unique, unmyelinated, and easily accessible part of the CNS within which to study the neurodegeneration and inflammation associated with the disease. This has fueled extensive interest in utilization of OCT with macular intra-retinal segmentation in order to study in vivo the effects of MS-related disease processes in the retina.
The primary OCT measure that has been utilized in the study of MS eyes is the peripapillary RNFL thickness. The use of macular intra-retinal segmentation has also allowed the measurement of the macular RNFL and GCL+IPL thicknesses, measures that in general are considered to convey similar information. These measures have been shown across OCT platforms and segmentation algorithms to exhibit excellent reproducibility, and both measures have been shown to be decreased in MS eyes relative to healthy controls irrespective of ON history, but the decreases are significantly greater in eyes with a clinical history of ON [5, 6, 18–20].
Following ON, the thickness of the peripapillary RNFL and GCL + IPL have been shown to exhibit a decrease over time, with most thinning occurring during the first three months and continuing for six months to one year after onset [21, 22]. During the initial phase of ON, however, the two measures exhibit different characteristics: the GCL + IPL thickness appears to be unaffected initially, whereas the peripapillary RNFL thickness may exhibit increased thickness, most likely due to axonal edema. Thus, when utilizing peripapillary RNFL measurements in acute ON to follow patients longitudinally, it is inherently difficult to differentiate between resolution of edema versus true atrophy of the peripapillary RNFL. Approaches to this problem have included utilizing the fellow “unaffected” eye to establish baseline measures; however, this approach has significant shortcomings due to the fact that often patients with multiple sclerosis have experienced ON in their fellow eye and also since it is known that, even in the absence of a clinical episode of ON, peripapillary RNFL thinning occurs in MS. This is an important factor and makes the GCL + IPL appear to be a more useful measure in acute ON since establishing with confidence a baseline measurement, since establishing with confidence a baseline measurement that can be followed longitudinally is extremely important in order to reliably employ a measure in clinical practice as well as in research studies.
Multiple studies have demonstrated the functional relevance of RNFL and GCL + IPL atrophy by showing that thinning of these layers correlates with visual dysfunction in MS, as measured by assessment of high- and low-contrast visual acuity [6, 19, 23]. Additionally, these layers have been shown to correlate with the Expanded Disability Status Scale (EDSS; a global measure of disability in MS) and with MRI measures of brain atrophy, correlations that are predominantly observed in the absence of a history of ON, suggesting that the atrophy of inner retinal layers observed in non-ON eyes may reflect global neurodegenerative processes in MS [18, 24, 25]. Longitudinal studies in MS have shown that the peripapillary RNFL exhibits accelerated thinning in MS compared to healthy controls, even in the absence of ON, and this has been shown to correlate with clinically significant visual loss and with relapses during follow-up [26, 27]. However, data are conflicting and other studies have been unable to recapitulate these findings [28–30]. One longitudinal study utilizing macular intra-retinal segmentation showed that accelerated thinning of the GCL + IPL also occurs in MS in the absence of clinical episodes of ON and that the rate of thinning is significantly increased in those patients with more active disease, as defined by clinical relapses, presence of gadolinium-enhancing lesions and/or new T2-hyperintense lesions [30].
As previously mentioned, abnormalities of deeper retinal layers have also been reported in MS on the basis of pathologic and electrophysiologic studies [12–15]. Quantitative abnormalities of deeper retinal layers in OCT studies utilizing macular intra-retinal segmentation have also been reported in MS; however, results vary. In one study, thinning of the deeper retinal layers (INL + OPL and ONL + PR) was demonstrated to occur in a subset of MS patients in eyes without a history of ON that had normal peripapillary RNFL thickness [5]. Patients with eyes exhibiting these characteristics were determined to exhibit a macular thinning predominant (MTP) retinal phenotype and were shown to have accelerated accumulation of global disability, as demonstrated by higher Multiple Sclerosis Severity Scores (MSSS), a measure of disability adjusted for disease duration. It was suggested that these retinal abnormalities may be due to a primary retinal process that occurs independent of optic nerve pathology, but this thinning of deeper retinal layers has not been consistently shown to occur in other studies. Furthermore, an entity that has been termed microcystic macular edema (MME; Figure 13.3), which predominantly affects the INL, has been recently described in association with optic neuropathies of various etiologies, including MS, NMO, CRION, optic nerve glioma associated with neurofibromatis type I, and Leber’s and Tanzanian hereditary optic neuropathy [31–38]. MME was first described in association with MS, and in studies that have systematically examined for the presence of MME in MS (of which one employed macular intra-retinal segmentation), this pathology was reported to occur in 4.7–6% of MS patients [15, 31, 32]. MME eyes had more frequently experienced a prior episode of symptomatic ON, had worse letter acuity at both high- and low-contrast and correspondingly more severe thinning of the RNFL and GCL + IPL, and patients exhibiting MME had experienced more rapid progression of their disease (i.e., higher MSSS scores). MME was found to be related to increased INL + OPL thickness, which was detectable in eyes prior to the development of visible MME, highlighting the potential for earlier and broader identification of this process with utilization of OCT segmentation [32]. Additionally, increased INL thickness has been shown to occur in MS eyes after ON in the absence of MME, and this increase has been shown to correlate with the atrophy observed in the GCL + IPL, suggesting that MME may represent the extreme end of a spectrum of INL pathology [32, 39]. Interestingly, one cross-sectional study showed that in RRMS the INL + OPL thickness exhibits a positive correlation with T2 lesion volume and an inverse correlation with normal appearing white matter [24]. Moreover, in the one longitudinal study of MME that employed macular intra-retinal segmentation, increased INL thickness at baseline was associated with increased clinico-radiological disease activity during follow-up (relapses, EDSS progression, new T2 and contrast-enhancing lesions) [32]. This finding must be validated by further studies but highlights the potential of OCT segmentation for identifying novel biomarkers for neurological disease.
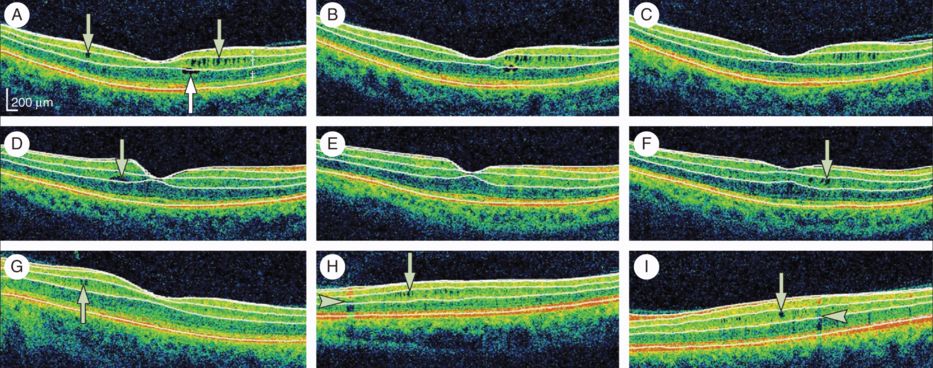
Microcystic macular edema of the inner nuclear layer as identified by spectral-domain optical coherence tomography, with automated segmentation lines displayed.
Optical coherence tomography (OCT) segmentation done in three dimensions shows the inner limiting membrane, the outer boundaries of the retinal nerve fiber layer (RNFL), inner plexiform layer, outer plexiform layer, and the inner boundary of the retinal pigment epithelium. The identification of these retinal boundaries enables the determination of the thicknesses of the macular RNFL, the ganglion cell layer and inner plexiform layer (GCL + IPL; labeled * in panel A), the INL (including the outer plexiform layer; labeled † in panel A), and the ONL (including the inner and outer photoreceptor segments; labeled ‡ in panel A). For panels A to C, all images were acquired from the same patient during a three-year period and are presented in chronological order. Microcystic macular edema (MME; green arrows) of the INL was present at baseline, as well as a foveal cyst of the outer nuclear layer (ONL; white arrow A). The ONL cyst progressively resolved during follow-up (B–C). For panels D to F, all images were acquired from the same patient during a two-year period and are presented in chronological order. A single INL cyst (green arrow) was present at baseline (D). The cyst spontaneously resolved after one year (E). After fingolimod treatment (initiated after scan E), the patient developed new cystic changes of the INL (green arrow; F). Panels G to I show three different patients with MME of the INL (green arrows). Vessel artifacts (arrow heads) are shown for comparison.
Neuromyelitis optica
Neuromyelitis optica (NMO) is an inflammatory disorder of the central nervous system, the cardinal manifestations of which are ON and longitudinally extensive transverse myelitis (LETM). Autoantibodies (NMO–immunoglobulin G [IgG]) targeting aquaporin-4 are found in the sera of the majority of patients with NMO. In approximately 50% of NMO patients isolated ON is the initial manifestation of the disease. ON associated with NMO carries a worse prognosis than in MS with 60% of NMO patients experiencing unilateral or bilateral blindness at a median of 7.7 years after disease onset, compared with 4% of MS patients with ON at 15-year follow-up [40]. Histopathologically, NMO lesions are not uncommonly associated with necrosis and cavitation, features that are not typically encountered in MS [41]. Unfortunately, retinal pathologic studies have not been performed in NMO and the data regarding retinal involvement in NMO is almost exclusively derived from studies utilizing OCT.
OCT studies utilizing conventional OCT measures have shown that the decrease that occurs in the peripapillary RNFL and macular volume following NMO-associated ON is substantially greater than in MS, and this has been proposed as an important differentiating factor between the two conditions [42–44]. Also, the pattern of peripapillary RNFL atrophy appears to differ, with NMO-ON resulting in severe thinning of all quadrants, whereas MSON is predominantly associated with temporal thinning [42, 44]. Intra-retinal segmentation has allowed for more specific observations to be made and studies have shown that not only the peripapillary RNFL, but also the macular-RNFL and GCL + IPL are more severely affected in NMO [22, 45].
Furthermore, MME of the INL has been shown to occur in 18–26% of patients with NMO-spectrum disorders, a prevalence substantially greater than that observed in MS (~5%).[33, 34, 45] Moreover, MME in NMO appears to be more closely linked with ON, with MME being exclusively identified in eyes with a history of symptomatic ON. As in MS, MME in NMO has been shown to be associated with increased thickness of the INL and poor visual function and is present in eyes that have severe retinal axonal and neuronal loss, as demonstrated by greater decreases in the thickness of the RNFL (peripapillary and macular) and GCL + IPL when compared to NMO-ON eyes that have not developed MME.
The etiology of the higher prevalence of MME in NMO relative to MS has been proposed to be due to the increased severity of NMO-ON, with MME representing a marker of axonal and neuronal injury. Alternatively, it has been thought that a primary retinal process occurring in conjunction with ON may be responsible. Aquaporin-4 (the target of the immune response in NMO) is highly expressed in the retina by Müller glial cells (the cell bodies of which are located in the INL), especially in end-feet membranes facing blood vessels [40]. Thus, a plausible and intriguing hypothesis is that following acute ON and breakdown of the blood–retinal barrier, an immune response directed against aquaporin-4 in the retina may contribute to the development of MME and account in part for the poor visual outcomes in NMO-ON. In any case, further studies and characterization of MME is necessary in order to clarify the pathogenesis of this retinal phenotype.
Additionally, subclinical involvement of the visual pathway has been suggested to occur in NMO spectrum disorders, with some studies identifying decreased RNFL and GCL + IPL thicknesses in NMO non-ON eyes, but data are conflicting [22, 33, 42, 43, 46–48].
Related posts:
 Optical coherence tomography and low-contrast acuity
Introduction to optical coherence tomography in neurological diseases
Optical coherence tomography in acute optic neuritis
Optical coherence tomography and electrophysiology of the visual pathway
Optical coherence tomography and visual outcomes in acute optic neuritis
Optical coherence tomography in a multi-center setting: quality control issues
Optical coherence tomography and low-contrast acuity
Introduction to optical coherence tomography in neurological diseases
Optical coherence tomography in acute optic neuritis
Optical coherence tomography and electrophysiology of the visual pathway
Optical coherence tomography and visual outcomes in acute optic neuritis
Optical coherence tomography in a multi-center setting: quality control issues
Stay updated, free articles. Join our Telegram channel

Full access? Get Clinical Tree


