This image demonstrates RNFL defects visible on red-free photography in the left eye of a patient with optic neuritis in association with multiple sclerosis. There are visual field defects in areas of the visual field corresponding to the visible RNFL defects.
Unfortunately, although examination of the RNFL is possible with a hand-held ophthalmoscope, an approximately 50% loss of axons is required before RNFL changes are visible [19], and the loss is not readily quantifiable.
Retinal nerve fiber layer changes in optic neuritis using optical coherence tomography
Parisi and colleagues [20] examined 14 patients with multiple sclerosis, all of whom had a prior episode of optic neuritis with complete visual recovery. Using early generation optical coherence tomography (i.e., time-domain OCT), they found that peripapillary RNFL thickness was significantly reduced in eyes affected by optic neuritis when compared with healthy control eyes, and was also reduced in clinically unaffected fellow eyes but to a lesser extent. This study did not attempt to find an association with clinical tests of visual function and did not study the macula using OCT.
Trip and colleagues [21] used Stratus OCT (Carl Zeiss Meditech, Palo Alto, CA) to study 25 patients with a history of a single previous attack of optic neuritis and poor visual recovery, comparing their affected eye with their clinically unaffected fellow eye, and with the eyes of 15 healthy control subjects. They found significant reductions of RNFL thickness (68.7 μm in affected eyes vs 94.6 μm in fellow eyes vs 102.9 μm in control eyes) and macular volume (6.10 mm3 in affected eyes vs 6.71 mm3 in fellow eyes vs 6.83 mm3 in control eyes) in the affected eyes of patients, when compared with both their clinically unaffected fellow eye and the eyes of control subjects. Reduced RNFL thickness was significantly correlated with worse visual function for LogMAR acuity, Humphrey visual field mean deviation, and color vision. Reduced macular volume correlated with reduced color vision, but not with reduced overall field sensitivity, nor with visual acuity.
Costello and colleagues studied 54 patients recruited within one month of onset of an attack of optic neuritis and found reductions in the retinal nerve fiber layer of the affected eyes when compared with that of the fellow eyes of the same group (77.5 μm in the affected vs 99.8 μm for the fellow eye) [26]. Lower RNFL values were correlated with worse visual field mean sensitivity, and those patients with worse vision had significantly lower RNFL values. The authors hypothesized that the majority of the RNFL thinning would be evident by between three and six months after the acute attack, although they were not able to analyze their data to calculate the time to first detectable thinning.
Since these papers, several other authors have replicated the findings in the chronic stage, long after an attack of optic neuritis, when vision is stable (see Table 4.1 and Figure 4.2). Petzold and colleagues [2] have performed a meta-analysis of most of these studies. They found that the mean loss of RNFL thickness due to optic neuritis was 20.38 μm, using the fellow eye as a baseline comparator. This may be an overestimate due to ascertainment bias in early studies of acute optic neuritis, and some patients may have significantly less thinning.
| Optic neuritis | Fellow eyes | Healthy control | ||||
|---|---|---|---|---|---|---|
| Mean (SD) | n | Mean (SD) | n | Mean (SD) | n | |
| Trip (2005) [21] | 68.7 (18.8) | 25 | 94.6 (14.9) | 25 | 102.9 (14.6) | 15 |
| Fisher (2006) [25] | 85 (17) | 63 | –* | – | 105 (12) | 72 |
Costello (2006) [26] | 77.5 | 54 | 99.8 | 54 | – | – |
| Albrecht (2007) [27] | 74.47 (22.15) | 21 | – | – | 103.4 (10.96) | 11 |
Pulicken (2007) [28] | 84.2 (14.7) | 62 | 93.9 (13.1) | 62 | 102.7 (11.5) | 47 |
| Pueyo (2008) [29] | 84.46 | 25 (eyes) | 94.2 | 75 (eyes) | 104.97 | 25 (eyes) |
| Zaveri (2008) [30]** | 81.8 (19.3) | 41 | 95.6 (15.0) | 48 | 104.6 (10.3) | 43 |
| Klistorner (2008) [31] | 84.5 (15.1) | 32 | 103.8 (10.8) | 32 | 104.0 (9.2) | 25 |
Siger (2008) [32] | 83.9 (17.6) | 20 | 91.08 (19.3) | 20 | 100.3 (12.1) | 12 |
Frohman (2009) [33] | 70.3 (13.4) | 12 | 101.8 (6.0) | 12 | 101.9 (8.9) | 8 |
Ratchford (2009) [34] | 88.3 (2009) | 155 | – | – | 102.4 | 77 |
Burkholder (2009) ** [35] | 85.7 (19.0) | 164 (328 eyes) | 95.6 (14.5) | 366 (730 eyes) | 104.5 (10.7) | 111 |
Bock (2010) {Bock:2010 da} | 86.2 (16.2) | 73 (eyes) | 97.0 (13.1) | 189 (eyes) | 105.2 (9.4) | 203 |
| Garcia-Martin et al. (2011) [36] | 81.2 | 34 | 94.9 | 34 | – | – |
Syc (2012) [37] | 78.7 (11.7) | 73 (eyes) | 84.9 (12.2) | 123 (eyes) | 93.4 (10.4) | 100 |
Costello et al. (2012) [38] | 90.8 (16.9) Females 73.5 (14.0) Males | 105 (Females) 39 (Males) | 103.4 (14.0) Females 100.1 (13.8) Males | 105 (F) 39 (M) | – | – |
| Monteiro et al. (2012) [39] | 94.6 (19.0) | 45 (eyes) | 101.2 (11.6) | 74 (eyes) | 107.6 (9.4) | 82 (eyes) |
* Direct comparison between patients with one eye affected not published
** Some patients had bilateral optic neuritis; fellow eyes have no clinical history of optic neuritis but the whole cohort had confirmed multiple sclerosis.
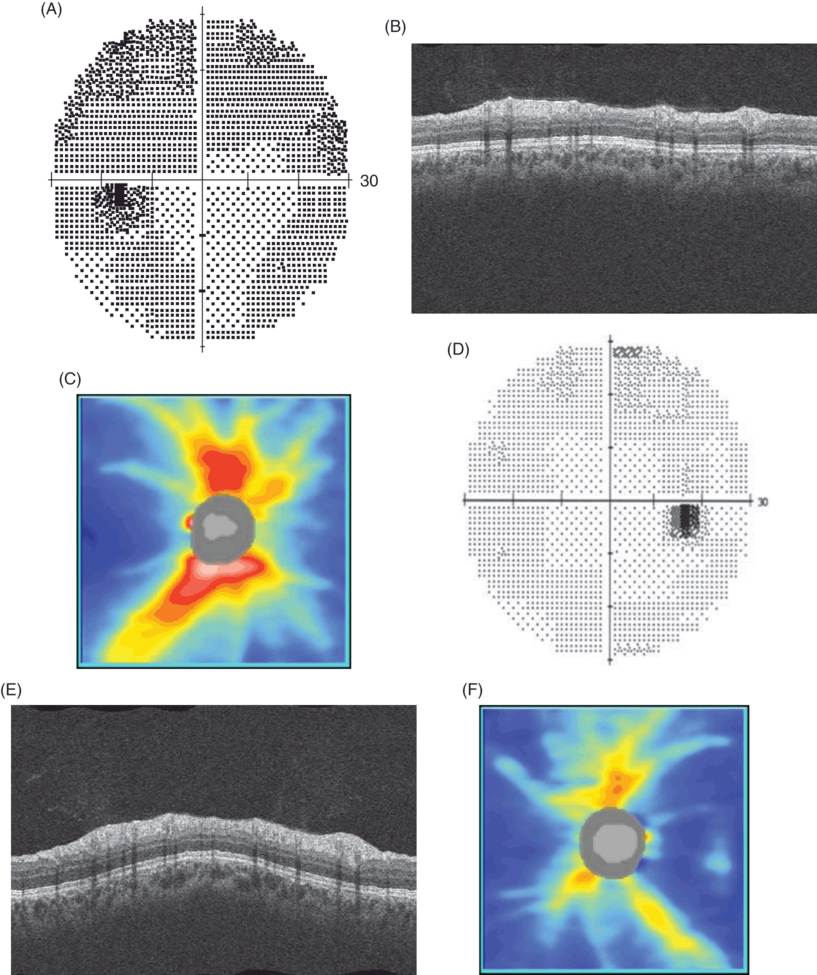
Visual fields (A. and D.), OCT images of the circumpapillary retina (B. and E.), and RNFL thickness maps of the peripapillary retina (C. and F.) in a 20-year-old woman four months after unilateral left-sided optic neuritis associated with multiple sclerosis.
The visual acuity in the right eye was 6/5 and in the left eye was 6/6. There is reduced RNFL thickness on the left (circumpapillary RNFL thickness 72 µm compared with 109 µm on the right), despite good visual recovery.
In some patients, recurrent attacks of optic neuritis are associated with further reductions in RNFL thickness, and thereby depletion of optic nerve axons [22–24], suggesting that inflammation per se is involved in axonal degeneration, in addition to any effects mediated by compression of the optic nerve against the inelastic optic nerve sheath, or within the bony optic nerve canal.
Changes in the macula and deep layers of the retina
Trip and colleagues [21], in their cohort of optic neuritis patients selected for poor recovery, found that the overall macular volume in the affected eye was reduced when compared to that of the fellow eye (6.10 mm3 in affected eyes vs 6.71 mm3 in unaffected patient eyes) and also when compared to that of healthy control eyes (6.83 mm3). Pulicken and colleagues [28] found reduced macular volume in the eyes of subjects with a history of optic neuritis, in a cohort of patients with multiple sclerosis, as did Ratchford and colleagues [34]. Macular volume encompasses the whole retina from the vitreoretinal interface to the retinal pigment epithelium, and a reduction in volume likely reflects loss of other components of the retina rather than simply the RNFL.
We have observed small degrees of whole macular swelling in patients in the early phases of acute idiopathic optic neuritis, to a lesser extent than is visible in the RNFL, and it is usually only notable when the affected eye is compared to the unaffected fellow eye.
Gelfland and colleagues [40] reported the appearance of macular microcysts in the retina of patients with multiple sclerosis. Of the 318 patients studied, 15 (3.8%) had small lucencies in the deep layers of the retina. The microcysts, which they termed microcystic macular edema, occurred principally in the inner nuclear layer of the retina and were more common in eyes with a past history of optic neuritis, and were associated with greater thinning of the RNFL, and with a lower visual acuity. Microcystic macular edema was also associated with greater disability and more rapid progression. Saidha and colleagues [41] reported cystic changes in the macula of some of their patients (10/164, 6% of patients had microcysts evident on OCT). These changes were also associated with worse visual function and higher MS severity scores (although not higher disability as measured by the Expanded Disability Status Scale; EDSS). The presence of NMO is associated with worse vision, and in multiple sclerosis, with markers of increased disease activity such as increased contrast enhancing and T2 lesion formation. It is not clear what microcystic macular edema represents pathologically or pathophysiologically, as it is seen in other inflammatory optic neuropathies [42,43] and non-inflammatory optic neuropathies [44]. It may be that it represents only a marker of severity, perhaps related to trans-synaptic degenerative mechanisms [45]. Kaushik and colleagues [46] found inner nuclear layer thickening and retinal ganglion cell layer thinning to be inversely proportional, and proposed that inner nuclear layer thickening was on a spectrum which included microcysts of the inner nuclear layer at the more severe end.
Pathologic studies of the retina in patients with multiple sclerosis demonstrate that, in addition to atrophy of the RNFL, there is thinning of the ganglion cell layer and inner nuclear layers [47, 48]. Early forms of OCT lacked sufficient tissue penetration properties to quantify these changes, whereas spectral-domain OCT allows examination of the outer retinal layers such as the ganglion cell layer and the inner nuclear layer. Syc and colleagues [37] examined patients with multiple sclerosis, patients with neuromyelitis optica, and healthy controls, and they found reductions in a combined measure of the ganglion cell layer and inner plexiform layer (GCL/IPL) in eyes with a history of optic neuritis in their cohort of patients with multiple sclerosis when compared to control eyes and to eyes without a history of optic neuritis. They also serially studied a group of patients with acute optic neuritis and found that GCL/IPL thinning was evident at three months after the onset of symptoms. There was no swelling apparent in these layers of the retina, raising the possibility that atrophy of these layers of the retina might be detectable earlier than in the RNFL, where edema confounds early detection of tissue atrophy.
The time course of changes to RNFL and macula
In the early phases of optic neuritis there may be swelling of the RNFL [31,49,50] (see Figure 4.3). Although RNFL swelling is not evident in all cases of optic neuritis, RNFL measurement by OCT is more sensitive for the detection of RNFL swelling than fundoscopy, and is in keeping with the optic nerve swelling observed on MRI [51]. Studies using scanning laser polarimetry, which utilizes the birefringent properties of the RNFL to calculate its thickness, suggest that there is axonal loss evident in the RNFL in the early stages of acute optic neuritis [52], which is not detectable using conventional OCT because swelling of the axons of the RNFL obscures early axonal loss.
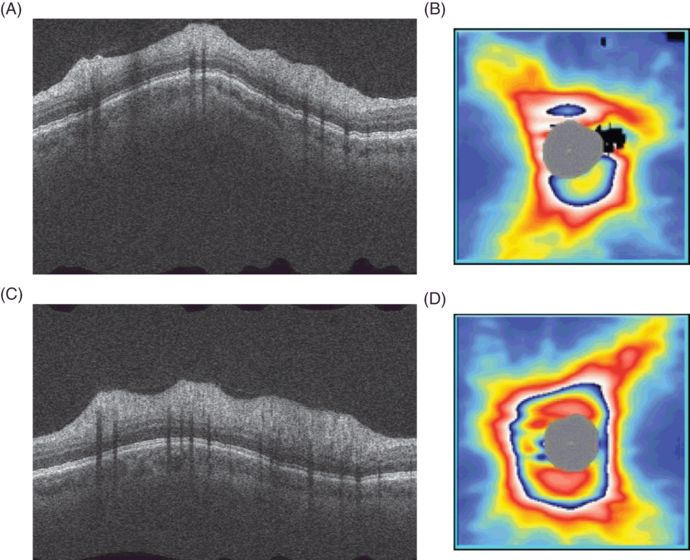
Asymmetric swelling of the RNFL in a patient with chronic relapsing inflammatory optic neuropathy (CRION[1]). The images were taken ten days after the onset of bilateral eye pain, pain on eye movement, and development of bilateral reduced visual acuity and visual field sensitivity. There is significant swelling of both RNFL, which is more marked on the left (average circumpapillary RNFL thickness 146 µm right and 223 µm left). A. and C. are circumpapillary OCT images of the retina of the left and right eye, respectively; the highly reflective RNFL at the top of the retinal image is markedly swollen. B. and D. are peripapillary thickness maps of the RNFL, again demonstrating marked swelling of the RNFL.
The swelling is most commonly followed by loss of RNFL thickness (Figure 4.2). The majority of RNFL thinning occurs in the first three months after symptom onset, and is near complete by six months [22,26]. Using modeled data from a cohort of patients with acute optic neuritis, we would predict that approximately half the RNFL loss will occur within one month of symptom onset and 99% of the loss will have occurred by 4.75 months [50].
Atrophy of the RNFL is detectable only after partial resolution of early edema and is likely to be detectable 1.5 to 2 months after the onset of symptoms [50] (see Figure 4.4). The time taken for loss of macular volume (our modeling suggests that 99% of the loss takes place by approximately 11 months) seems to be longer than that of RNFL thickness, suggesting that perhaps thinning of deeper layers, such as thinning of the ganglion cell layer, or different mechanisms, such as trans-synaptic retinal degeneration, are at play in the macula.
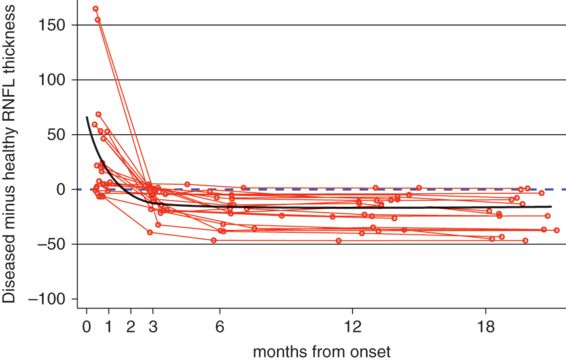
Model predicting the time course of RNFL thinning following a single episode of optic neuritis. Red lines indicate individual patient courses; the overall model is indicated in black; and the dashed line represents the time at which atrophy would be detectable using the fellow eye as comparison.
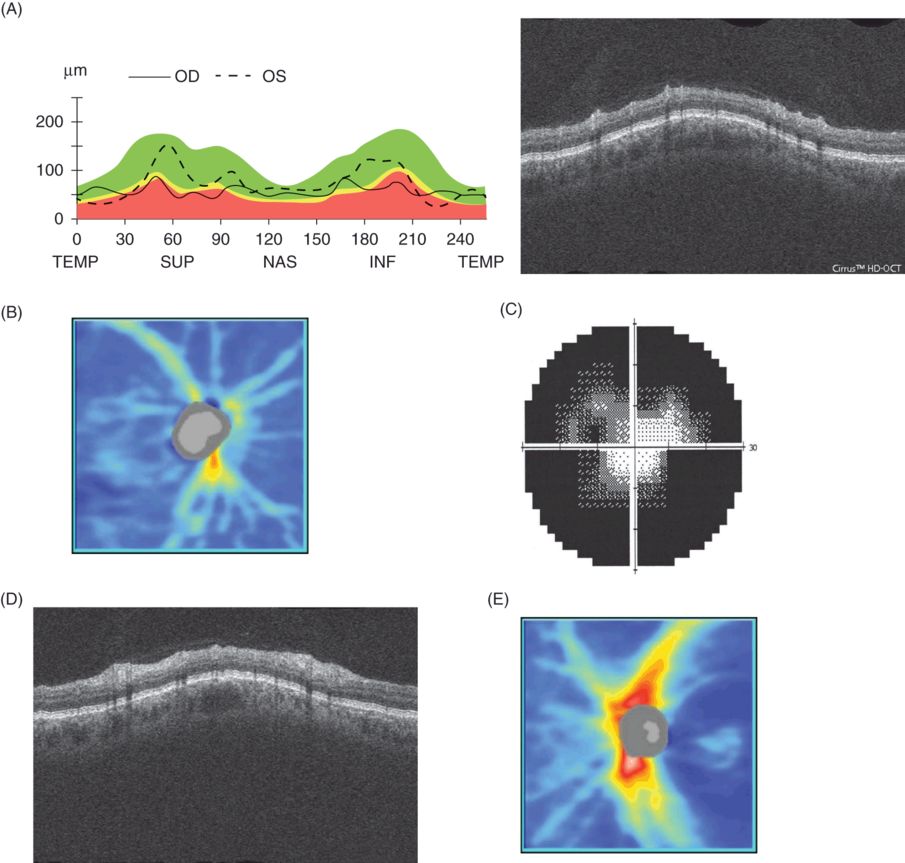
Left eye visual field (C.right eye not shown as NPL), OCT images of the circumpapillary retina (A. and D.) and RNFL thickness maps (B. and D.) from a 45-year-old man with neuromyelitis optica after multiple episodes of bilateral optic neuritis. A. shows circumpapillary RNFL thickness plotted against a normative database (95%, 5%, and 1% of normal eyes lie within the green, yellow, and red range as indicated).
The right eye had no perception of light and an unreactive pupil, and the corrected visual acuity in the left eye was 6/18.
Predictors of severity of RNFL loss
The eventual degree of axonal loss in the RNFL is variable after a single attack of optic neuritis, ranging from little or minor RNFL loss to significant loss with associated poor visual recovery. In our cohort of patients, we found baseline visual evoked potential (VEP) latency and amplitude, and baseline measures of visual function (full- and low-contrast visual acuity, and whole field mean deviation) were associated with later RNFL loss. Of these measures, full-field VEP latency and a measure of color vision, the Farnsworth-Munsell 100 Hue test, best predicted eventual RNFL loss [53], suggesting that initial axonal dysfunction is associated with later axonal death. Somewhat unexpectedly, the degree of initial RNFL edema is not strongly associated with the eventual RNFL atrophy.
Costello and others [38] studied a group of patients with optic neuritis and found there were sex-specific differences in the degree of RNFL loss after optic neuritis. Male subjects experienced greater RNFL loss in their affected eye. The authors suggested that the mechanism underlying this difference in outcome between genders might be related to the differences that underlie poorer outcome (in terms of destructive lesion load and overall disability) for men when compared with women with multiple sclerosis [54,55].
Changes in the retina in neuromyelitis optica
Neuromyelitis optica (NMO) is an inflammatory demyelinating disease in which the pathology is most often concentrated in the optic nerves and spinal cord. It is pathologically distinct from multiple sclerosis [56], with greater loss of both oligodendrocytes and neurons, and characteristic abnormalities of astrocytes [57]. In the majority of patients, it is associated with the presence of antibodies to aquaporin-4 [58,59]. Neuromyelitis may present with either optic neuritis (both bilateral and unilateral) or transverse myelitis, or both [60].
The optic neuritis associated with NMO is often severe and is associated with poor recovery. Of the 12 patients documented in O’Riordan and colleagues’ case series [61], 10 had count fingers or worse vision in one or more eyes. Of these 12 patients, 10 had a bilateral optic neuropathy due either to recurrence in the fellow eye or simultaneous optic neuritis. At the nadir of vision in neuromyelitis associated optic neuritis, visual acuity is usually count fingers or worse [60,62], and recovery is typically not as complete as in acute idiopathic optic neuritis. Recurrent attacks are associated with further reductions in vision [23, 60, 63–65].
Ratchford and colleagues [34] studied a small cohort of patients with NMO. When compared with patients with multiple sclerosis, optic neuritis in NMO resulted in more severe RNFL thinning and macular volume loss, and there was more visual loss than in multiple sclerosis-associated optic neuritis. Using multivariate linear regression, they estimated that the initial attack of optic neuritis caused, on average, a 31µm reduction in the nerve fiber layer thickness, and each further attack resulted in approximately 10 µm of thinning.
Fernandes and colleagues [66] studied a group of patients with optic neuritis due to NMO, and compared them to a group of patients with optic neuritis due to multiple sclerosis and healthy controls. Although RNFL and ganglion cell layer atrophy were evident in both multiple sclerosis and in NMO, only patients with neuromyelitis optica had swelling of the inner nuclear layer. Sotirchos and colleagues [67] examined 39 patients with NMO and a group of healthy controls. They found microcystic macular edema was present in patients with a history of acute optic neuritis and was associated with more severe thinning of the RNFL and ganglion cell layer, and with poorer vision. Both Sotirchos and colleagues and Gelfand and colleagues found microcystic macular edema to be more prevalent in their cohorts of patients with neuromyelitis optica (26% and 20%, respectively) than in previously reported cohorts of patients with multiple sclerosis (where it is seen in approximately 5% [40,41]).
Optic neuritis as a model of relapse in multiple sclerosis
The optic nerve is part of the central nervous system, and, as such, can be considered a white matter tract. Optic neuritis resulting from a demyelinating lesion of the optic nerve is a common and characteristic initial manifestation of multiple sclerosis. The anterior visual pathway, including the optic nerve and RNFL, can be studied functionally (with quantitative tests of vision), structurally (with optic nerve and retinal imaging), and electrophysiologically (by measuring the visual evoked potential). Study of optic neuritis can give insights into the mechanisms of demyelination and remyelination, and loss and return of function in the demyelinating lesion in multiple sclerosis [73, 74]. The other significant advantage in favor of using optic neuritis as a model of acute inflammatory demyelination in proof of principle trials of neuroprotective agents is that the events of optic neuritis are complete within six months of the onset of symptoms, significantly curtailing the length of time taken to conduct phase II studies.
For the purposes of clinical trials, sample size estimates have been generated for both RNFL thickness, and also for a composite of the ganglion cell layer and inner plexiform layer (GCL\IPL). For a six-month trial with 80% power, aiming to detect a 50% treatment effect, the per-arm sample size using RNFL as an endpoint would be 36 [50]. This assumes that patients with no prior history of optic neuritis are recruited, so the unaffected fellow eye can be used as a comparator to assess visual loss. If the fellow eye is previously affected, or is not used as a comparator, then per-arm sample size rises to approximately 58 if RNFL loss is used as an endpoint. For a similar trial using GCL\IPL as an endpoint sample size would be 44 per-arm [37]. Because there does not appear to be any swelling of the GCL\IPL complex in optic neuritis, sample sizes are not dependent on using the fellow eye as a comparator. Given that RNFL and GCL\IPL complex measures can be acquired on Fourier-domain OCT, it is likely that both measures will be used to evaluate the efficacy of putative treatments, although some devices do not possess the segmentation algorithm to do so. The utility of a treatment that preserved retinal ganglion cells but not their axons is questionable.
Sühs and colleagues assessed the efficacy of erythropoietin as a neuroprotective agent in acute optic neuritis, using RNFL thickness measured with OCT as the primary endpoint. They found that it was effective in reducing the RNFL atrophy following optic neuritis: in the treated group the median reduction in RNFL thickness was 7.5 µm whereas in the untreated group the median reduction in affected eye RNFL thickness was 16.0 µm. The trial required only 40 patients in total, and the primary outcome was measured at 16 weeks after randomization. Esfahani and colleagues [75] measured the effect of memantine given for two weeks after a first-ever attack of optic neuritis. Sixty patients were randomized 1:1 to either memantine (given as 5 mg daily for one week followed by 10 mg daily for two weeks) or a placebo. There was a significant difference in eventual RNFL thickness in the memantine treated group (91.3 µm vs. 78.9 µm in the placebo group) but no significant effect upon vision or neurophysiological measures of optic nerve function. Tsakiri and colleagues [76] evaluated the effect of simvistatin (80 mg daily for six months) upon the visual and neurophysiological measures of optic nerve function, and they found a beneficial effect on visual evoked potential latency and amplitude, but it did not quite (p = 0.06) reach the primary outcome of improving contrast sensitivity using Arden plates.
| NMO | NMO eyes without optic neuritis | Multiple sclerosis | Healthy control | |||||
|---|---|---|---|---|---|---|---|---|
| Mean (SD) | n | Mean (SD) | n | Mean (SD) | n | Mean (SD) | n | |
| de Seze et al. (2008) [68] | 77.9 (22.6) | 32 | – | – | – | – | 102.3 | 7.4 |
| Merle et al. (2008) [69] | 65.4 (25.2) | 15 | – | – | 83.9 (24.1) | 15 | 106.2 (24.5) | 23 |
| Naismith et al. (2009) [70] | 70.5 (26.2) | 22 | – | – | 80.7 (19.3) | 47 | – | – |
| Ratchford et al. (2009) [34] | 63.6 (20.3) (NMO) 96.3 (14.3 (LETM) | 26 | – | – | 88.3 (16.5) (past ON) 96.3 (14.3) (No prior ON) | 378 | 102.4 (11.0) | 77 |
| Green and Cree (2009) [71] | 59.2 (16.2) | 16 | – | – | 82.0 (17.6) | 20 | – | – |
| Nakamura et al. (2010) [64] | 63.8 (23.5) | 18 | 106.4 (14.5) | 8 (eyes) | 84.3 (14.2) | 14 | – | – |
| Monteiro et al. (2012) [39] | 82.7 (22.4) (NMO) 97.9 (10.7) (LETM) | 33 | 97.9 (10.7) | 94.6 (19.0) (past ON) 101.2 (11.6) (No prior ON) | 60 | 107.6 (9.4) | 41 | |
| Bouyon et al. (2013) [72] | 87.4 (23.3) (baseline) 79.7 (22.4) (follow up) | 30 | – | – | – | – | – | – |
| Lange et al. (2013) [23] | 63.7 (18.3) (one episode) 50.7 (8.1) (>1 episode) | 26 6 | 97.0 (11.1) | 18 | 73.9 (15.2) (prior ON) 93.2 (15.2) (no prior ON) | 13 37 | 98.4 (14.4) | 100 |
| Bichuetti et al. (2013) [65] | 65.3 (18.3) one episode 47.0 (6.1) two episodes | 8 7 | 85.7 (20.5) | 3 | 92.4 (14.0) (no prior ON) 80.1 (14.8) (one episode ON) 61.7 (7.1) (two episodes ON) 81.3(17.5)(three episodes ON) | 63 28 4 3 | – | – |
Several other trials using acute optic neuritis as a model of relapse and OCT as a primary or secondary endpoint are in the recruitment phase as this chapter is being written. The RENEW study (ClinicalTrials.gov Identifier: NCT01721161) is a trial of an anti-LINGO compound, BIIB-033. LINGO is an inhibitor of remyelination [77], and inhibition of LINGO promotes remyelination in animal models [78]. The primary endpoint is the change in optic nerve conduction, but RNFL thickness measured by OCT is a secondary outcome measure. The Amiloride Clinical Trial In Optic Neuritis (ACTION) study (ClinicalTrials.gov Identifier: NCT01802489) is a placebo-controlled trial of amiloride in acute optic neuritis. Amiloride blocks the acid-sensing ion channel and inhibits the influx of calcium, which can be associated with neuronal death [79]. The primary outcome measure is measurement of the RNFL thickness with scanning laser polarimetry; however, measurement of RNFL thickness by optical coherence tomography is a secondary outcome measure. There is also a phase II, double-blind, randomized controlled trial of phenytoin in acute optic neuritis (ClinicalTrials.gov Identifier: NCT01451593), which is using mean RNFL thickness as the primary outcome measure. Phenytoin, which blocks voltage-gated sodium channels, reduces the severity of, and preserves axonal integrity in, experimental allergic encephalomyelitis [80]. This study aims to recruit 90 patients and has a primary outcome measure that is measured at six months. The Fingolimod in Acute Demyelinating Optic Neuritis trial (ClinicalTrials.gov Identifier: NCT01757691) is assessing the neuroprotective effect of fingolimod in acute optic neuritis as measured using OCT of the retinal nerve fiber layer.
Optical coherence tomography has given considerable insight into the pathophysiology and clinical characteristics of acute optic neuritis. It also allows acute optic neuritis to be used as a model of the acute relapse in trials of neuroprotection, which require relatively small numbers and are quick to reach the final time point.
References
Related posts:
 Optical coherence tomography and low-contrast acuity
Introduction to optical coherence tomography in neurological diseases
Future technological advances in optical coherence tomography
Optical coherence tomography and electrophysiology of the visual pathway
Optical coherence tomography and visual outcomes in acute optic neuritis
Optical coherence tomography in a multi-center setting: quality control issues
Optical coherence tomography and low-contrast acuity
Introduction to optical coherence tomography in neurological diseases
Future technological advances in optical coherence tomography
Optical coherence tomography and electrophysiology of the visual pathway
Optical coherence tomography and visual outcomes in acute optic neuritis
Optical coherence tomography in a multi-center setting: quality control issues
Stay updated, free articles. Join our Telegram channel

Full access? Get Clinical Tree


